
- MCO stock is 3.4% away from its 52 week low.
- MCO is up by 2.93% in a week, 3.59 in a month and 19.39 % in a year, all positive.
- MCO price is trading above all the important EMAs of 50, 100 and 200.
Market capital of Moody’s Corporation – $ 64.016 B
Current market price of Moody’s corporation – $ 348 .86
Financial Analysis of Moody’s corporation
In the previous session the price of Moody’s corporation is up by $ 5.66 i.e 1.65%. Price ended up in green for 3 consecutive sessions and moved $13.54 ( about 4%). Stock is up by 54% from its 52 week low level. MCO stock is 3.4% away from its 52 week high level and about 14% away from all time high.
Revenue of the company declined by ( -12.6 ) % in 2022 after surged by 72% in 6 years before 2022. Net income has also declined in 2022 by (-37.94 ) %, although it jumped by 730% in 6 years before 2022. EPS has also declined in 2022 by (36.87) % but before that the same story is repeated as the EPS jumped by 760%.
Net debt on the company is rising significantly as the net debt in 2016 was $1.14 B which is now standing at $ 6B. Cash and net receivable is rising in slow pace as it jumped by only $0.5 B whereas the net debt jumped by 4.86 B. Debt to assets ratio is 0.52 which is not at all a good figure for any company.
Company’s expected revenue is expected to rise slightly from $5.47B to $ 5.53 B. Net income is also expected to rise slightly from $ 1.37B and $ 1.43B. If we talk about dividend payout then the dividend yield is currently at 1%. Although if we observe carefully except 2022 the dividend yield is declining over years.
Technical Analysis of Moody’s Corporation :
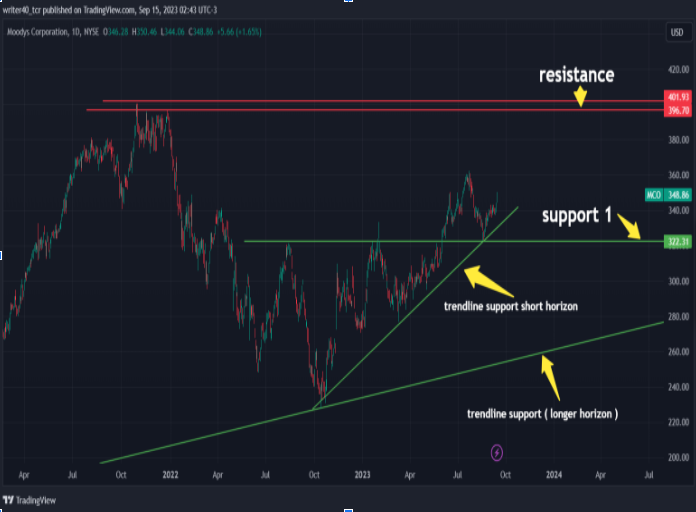
The price is currently in an uptrend as the price is almost 54% up from 52 week levels and only 3.4% away from 52 week high as we discussed above. The price is supported by a long term trendline as drawn in the chart as ( trendline supports longer horizon). The price is also supported by the short term rising trendline which is placed near to the level $ 330.
The price has breached the previous resistance levels near the price $343 which will not act as a support for the price. On a daily time frame the next major resistance is visible near to the price $362 i.e 52 week high level. There is no surprise visible on volumes even the price has raised in a single way recently which means there is no selling pressure as of now.
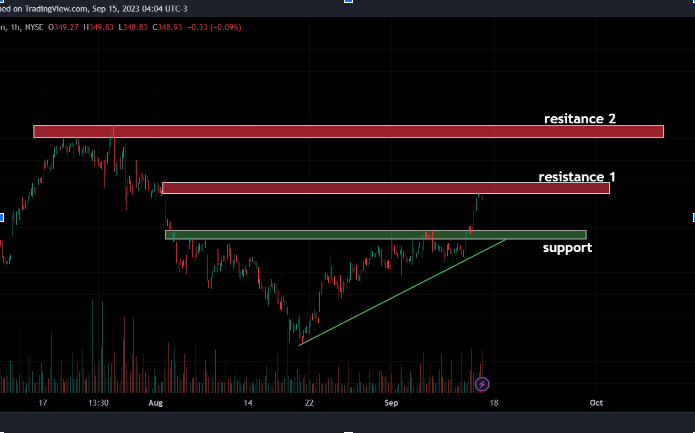
The price has given a breakout from a rising wedge pattern on 13th september, the price has shown a very positive follow through after the breakout. The price has surged almost 2% in a day which is considered as a good up move and now the price is facing some rejection near the resistance level of $350 drawn in the chart.
Conclusion
The price is currently facing a rejection from resistance 1 and if it breaks that, then it can go towards the resistance 2 i.e near $363. But if the price faces a strong rejection and starts to come down then it can take support near the support $ 342 -$340. The trendline which is present near $332 and rising can collide with the support and push the price up.
Technical levels
Resistance – $350 -$351
Support – $343 -$340
Disclaimer
The analysis is done for providing information through technical analysis and no investment suggestions are given in the article to be made by investors. The coins are unpredictable so investors should have proper knowledge. Cryptocurrencies are highly volatile and risky. Investment should be made with proper technical analysis.