
- NEO PRICE IS RECOVERING FROM ITS STRONG DEMAND ZONE .
- NEO PRICE IS TRADING NEAR ITS 52 WEEK LOW LEVEL i.e $ 5.94.
- PRICE DECLINED 53% FROM 52 WEEK HIGH AND MORE THAN 90% FROM IT’S ALL TIME HIGH.
MARKET CAPITAL OF NEO COIN – $ 519.92 M
CURRENT MARKET PRICE OF NEO COIN – $ 7. 37
Neo price is trading at $7.37 a decline of 0.21 % from previous day close as on 9 sept.
So far the price is down by 23.81 % in a year and 14.24 % in a month but the price surged 6.33 % in a week which shows that the buyers are active at the bottom levels helping the price to move up .
Price is trading very close to the long term demand zone i.e is lying between $6 and $4.
Previously the price reacted positively from this zone and price showed a good upside momentum from these levels which is a sign that buyers are very aggressive on this level.
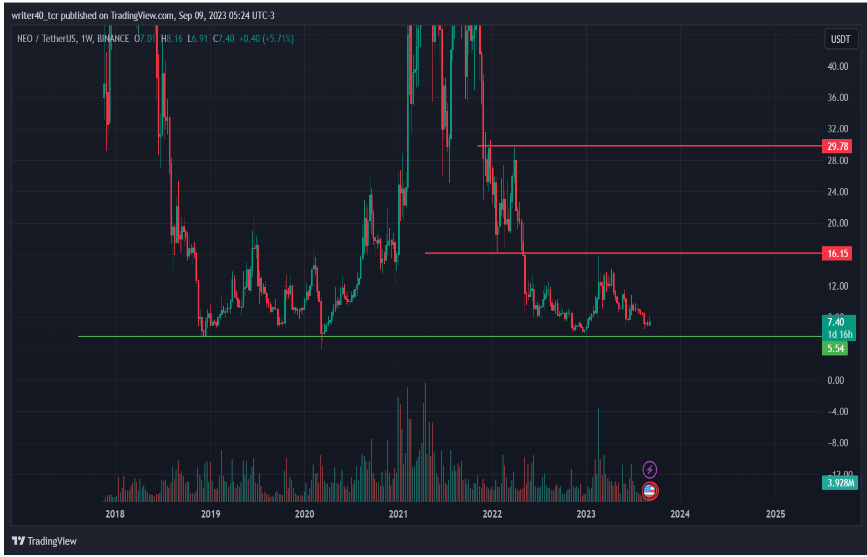
On the weekly chart the price is respecting the levels wonderfully and is currently respecting $16 on the higher side as resistance and $6 on the lower side as support ,the next resistance which is visible on the chart is present near $ 30 .
Price is clearly in strong bearish trend so price should breach $16 and sustain above so that the buyers will gain some confidence in this counter and start accumulating for some smart gains.
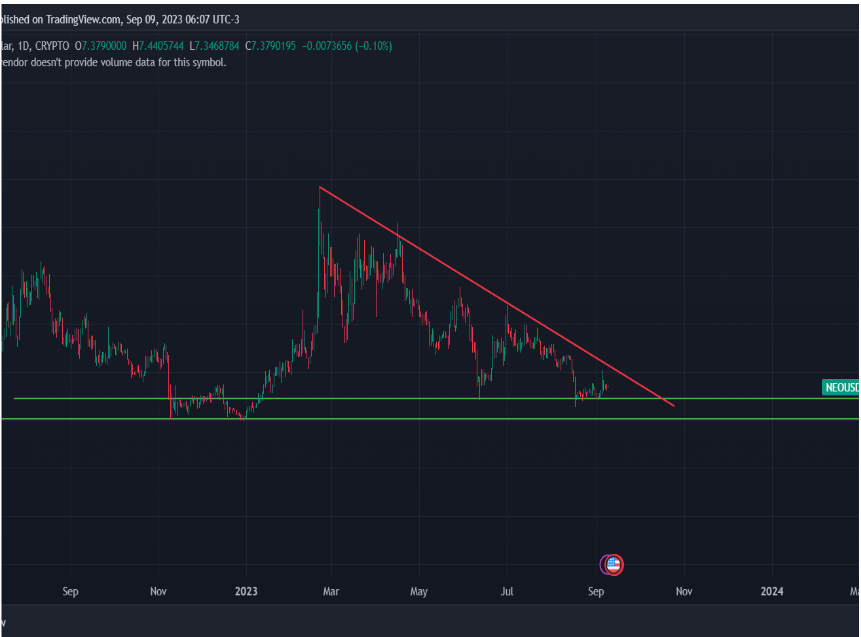
On a daily time frame the stock is forming a falling wedge pattern where the trendline resistance is present near $ 8 from where the price recently faced a rejection and support area is present between the levels $7 and $ 6 from where the price is getting a push.
The sellers are getting aggressive on the price but buyers are also standing firmly on the support level and price is waiting for the defeat of either buyers or sellers.
But this is not a suitable area to create a short position in this counter as the support area is strong and wide but once the price breaks the falling wedge pattern’s trendline then it will try to go up towards the level $13 .
In the 1 hour time frame the price is trading in a range created by a single candle created on 17 aug when the price declined and closed – 8%, since then the price is trading in this range. Although the price tried to escape from this range and gave a wonderful breakout supported by the volumes on 5th september but on the very next candle saw a huge selling again with a rise in volume indicating that the counter witnessed some profit booking which brought the price back to the zone.
The resistance level is $ 7.52 and $ 8. 078 and the support near $6.37, if the price is able to break this level in the future then only a trade can be taken, otherwise it can trade under this zone for more time.
CONCLUSION :-
As the price is trading near to the demand zone so it is not advisable to short the stock at this level if we consider the risk reward but if the price breaks the trendline in near future it can open the opportunity for the buyers to trade.
TECHNICAL LEVELS:-
RESISTANCE LEVEL- $7.6 – $8
SUPPORT LEVEL – $6.6 – $ 6.05
DISCLAIMER-
The views and opinions stated by the author, or any people named in this article, are for informational purposes only and do not establish financial, investment, or other advice. Investing in or trading crypto assets comes with a risk of financial loss.