- MKS is a British retailer of clothing, home products, and luxury food products.
- MKS was founded in 1884 by Sir Michael Marks and Thomas Spencer. The stock is listed on the London Stock Exchange.
- In this article, we will analyze the MSN stock price.
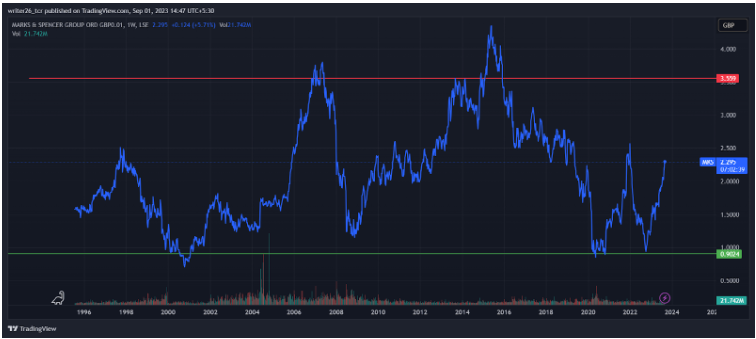
MKS has been in a sideways position since 2001. The stock has been trading in a range between the support level and the resistance level. The chances of breakout are not very clear. The chances of the stock moving up or breaking its range are also not too high. The stock has been in this range since 2001.
However, the volume chart of buyers and sellers is somewhat equal. The presence of bulls was high in 2004, as visible in the volume chart. In the years 2007 and 2008, the presence of bears was visible in the volume chart.
Moreover, in 2020 also bulls were dominating the volume chart. The breakout can be in the downward direction or it can be in the upward direction also.
Technical Analysis of MKS (Yearly)
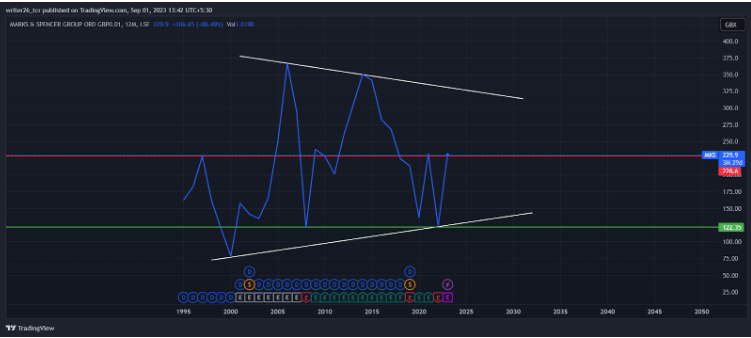
The stock is in the range between the support level and resistance level in the yearly time frame analysis. If the stock gives any breakout in the future, it is not sure where it will move. It does not seem the right choice for a long-term investment. Investors should invest their money in trending companies or growing companies.
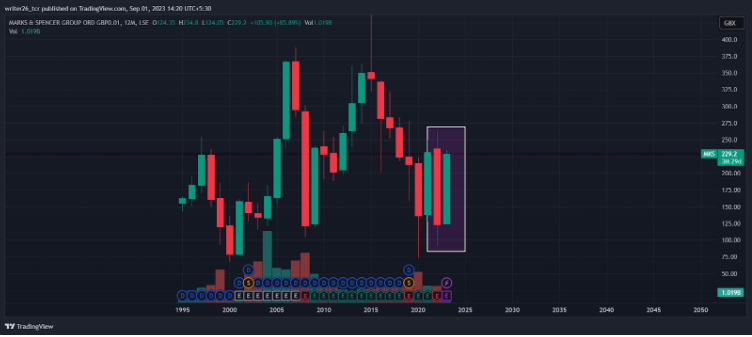
The pattern present in the rectangle represents bullish harami. It is a candlestick chart indicator, used for spotting reversals in the bear trend. This pattern indicates that the price may show upward movement in the future. The stock may not cross or break its resistance level.
Technical Analysis of MKS(Monthly)
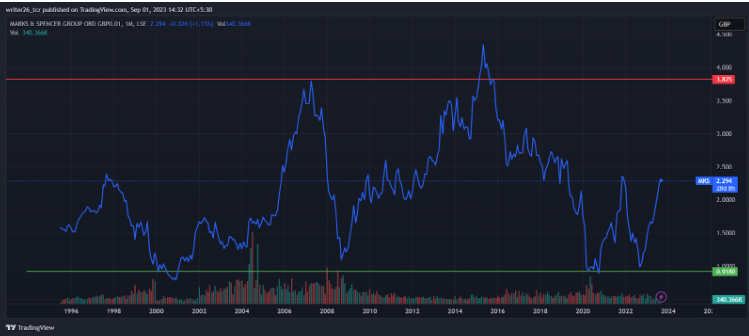
In the monthly time frame, the stock is in a sideways position. It is taking support from the bottom support level. It is trading between the range. So, here also it does not look good for a long-term investment. This stock is only good for small returns.
The pattern in the rectangle represents three white soldiers, indicating the stock may continue its upward movement in the future. The stock near the current price can go up due to the pattern formation.
Technical Analysis of MKS (Weekly)
In the weekly time frame, the stock is in a sideways position. Its position is the same in yearly, monthly, and weekly time frames. The stock is not an ideal choice for a long-term or mid-term investment. It has been trading in the range between the support level and resistance level.
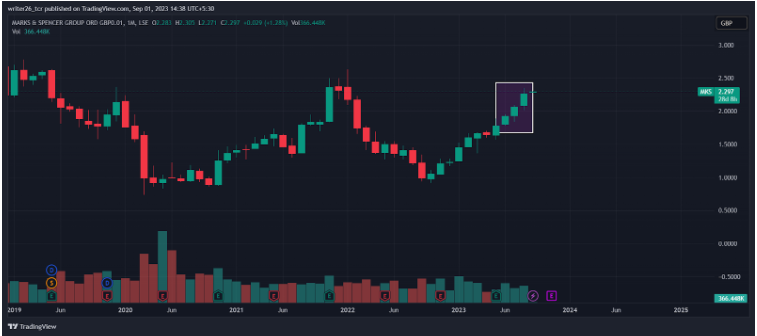
Technical Analysis of MKS (Daily)
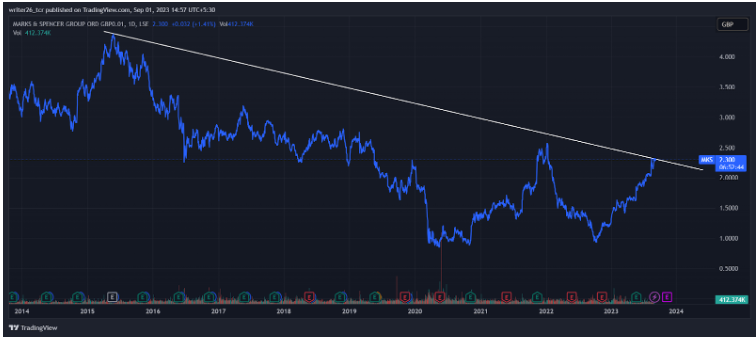
In the daily time frame, the stock is in a downtrend trend. However, near the current market price, the MKS share is in an uptrend. It can make another resistance point on the trend line and continue its downtrend move. However, if it gives any breakout, an uptrend is possible. This stock is good for short sellers in intraday trading.
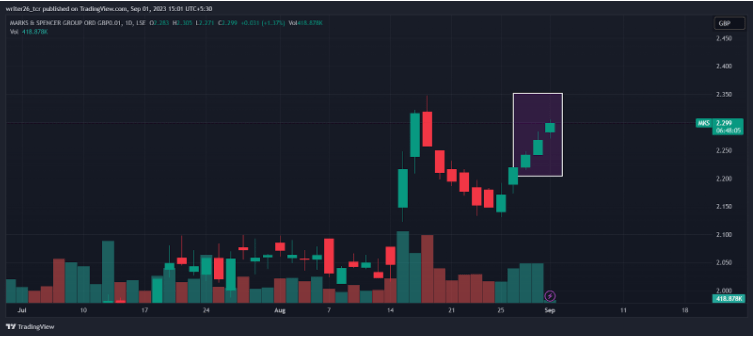
The pattern in the rectangle gives a second confirmation that the stock may continue its uptrend movement. The first confirmation was the uptrend! The pattern in the rectangle is three white soldiers. They indicate that the stock may continue its uptrend.
Summary
The stock remains in a sideways position in the yearly, monthly, and weekly time frame. So, it is not an ideal choice for positional or swing trading. Yet, it is in an uptrend in the daily time frame. It can be an ideal pick for traders.
Levels
Resistance Level- GBP- 1.9265 and GBP- 2.478(Daily Time Frame)
Support Level- GBP- 1.4950 and GBP- 1.3260(Daily Time Frame)
Disclaimer
The analysis is done to provide information through technical analysis and no investment suggestions are given in the article.