
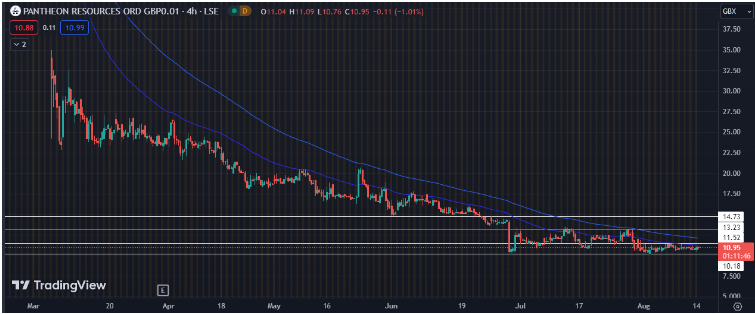
- PANR stock price has been declining from the beginning of this year, delivering a negative 75% return for its investors.
- £10.18 has become a strong support level for the stock since july.
- Negative financials have added to the list of challenges for the stock.
Pantheon Resources Plc, headquartered in London, is an independent oil and gas exploration and production company operating in the UK. With full ownership of various high-impact oil projects concentrated on the Alaskan North Slope, covering an extensive area of more than 150,000 acres, the company has maintained its focus on this region since its establishment in 2005.
However, the company has grappled with consistent challenges in its financial performance. Its cash flow has demonstrated inconsistency over the years, reflecting a less favorable financial trajectory. This weak foundation and the overall subpar fundamentals have contributed to a lack of readiness among potential buyers to enter the stock.
Technical Analysis of PANR Stock
As the charts show, PANR stock has been constantly moving downwards. The year started for the stock at around £40 and the stock has constantly followed a bearish momentum since then. The stock is currently at its low of £10.8 and is trading very close to its support level at £10.18.
On examining the past movement, this current support at £10.18 looks like the only hope for investors as the stock has not breached this level in over 3 years now and if it does, there is no telling how far down the stock may fall.
The stock currently seems weak as it saw a sharp sell-off in recent times and therefore, chances for the stock price to rise are low as of now.
Earnings are expected to be declared in December which could be a ray of hope for investors, but looking at the financial history of the company, there is not a lot that can be expected.
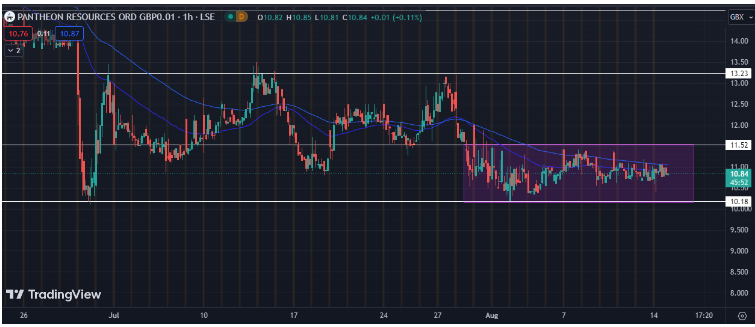
The current setup shows the stock taking support from £10.18 and moving sideways since then. The stock looks trapped within the current narrow zone between £10.18 and £11.52 and we must wait for the stock to break out of this range on either side to expect a bigger move.
Volumes have reduced significantly, which is clear from the small sized candles that the stock is producing.
The stock is taking support from the 50-day EMA which is positive for the investors. The current setup is not painting a clear picture about the stock’s future and the next 10-12 trading days will be very important for the stock. If there is an upside from the current levels, £11.5 would be a good target.
If the stock price falls below the current support level, the next support is at £7.1, which would be a significant decline.
Conclusion
The stock looks weak on the daily chart but the hourly chart is showing small signs of recovery. The stock is currently range bound and the next few weeks may be crucial for the stock in determining its future. The stock should be on people’s watchlist as a big move might occur any day now.
Major technical levels
Major support levels- 10.18£ followed by 7.1£
Major resistance levels- 11.5£ followed by 12.5£.