- The TON coin is the primary cryptocurrency of the Toncoin blockchain network. The entire supply is limited to 5 Billion TON coins.
- It is up by 242.18% overall which is a good number for any cryptocurrency.
- Let’s analyze the price variations of the TON token.
The coin from the start is continuously in a sideways position in the yearly time frame. It came into the market in 2022.
For any cryptocurrency, the 2022 year is known as the Bloodbath year. There were many reasons for the fall in the cryptocurrency market.
The fall in the world’s most famous coin “Bitcoin”, fell to $25,000 from its all-time high which was $69,000.
FTX’s bankruptcy is another reason for the fall in the cryptocurrency market. FTX is one of the largest global cryptocurrency exchanges.
Technical Analysis of the TON Token (Yearly)
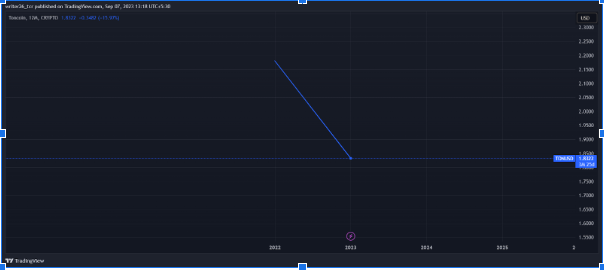
The coin came into the market in 2022. From the beginning, it has been downward because of the bloodbath in 2022 in the cryptocurrency market.
The coin is highly risky due to its trend. Investors should invest with proper knowledge about the cryptocurrencies.
The market is highly volatile and is not under any regulatory or authority.
Technical Analysis of the TON Token (Monthly)
Source: CRYPTO: TONUSD by Trading View
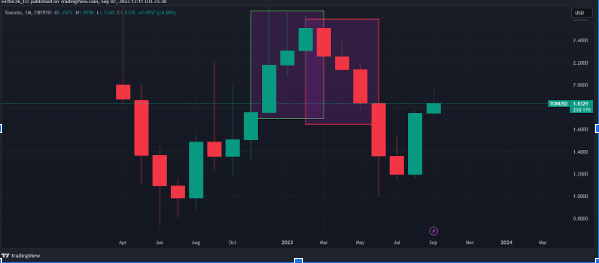
The coin is in the sideways position in the monthly time frame. At first, it started its journey in the downward direction.
In July 2022, it started moving up and was continuously on the uptrend.
In Feb 2023, which is also known as a bad period for the crypto market all cryptocurrencies were down.
The pattern in the first rectangle represents three white soldiers and the second rectangle represents three black crows.
The first pattern indicates that the coin may continue its up movement but as the market is uncertain. It failed to continue its move.
The second pattern indicates that the coin may continue its down movement and it continues the down movement.
Technical Analysis of the TON Token (Weekly)
Source: CRYPTO: TONUSD by Trading View
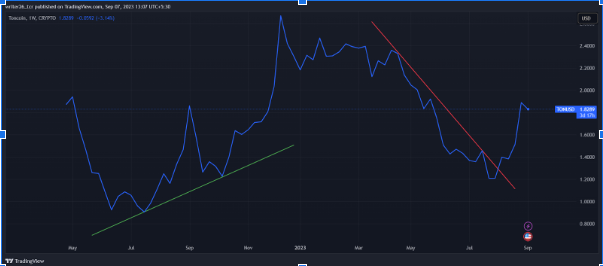
The coin in the weekly time frame was going in a robust upward direction. It showed some sideways position.
It has broken the downtrend line and given a breakout, which is a good sign of recovery. Essentially, the coin price is moving in a range between the support level and the resistance level.
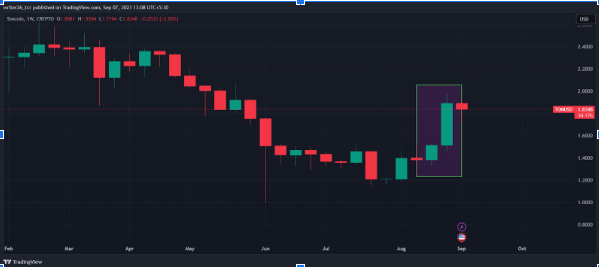
Coin is unable to make another green candle which can boost the chances of recovery.
Further, it was making three red candles which pushed the price in the downward direction.
The coin is not suitable for long-term investment. It is highly risky to invest in these types of cryptocurrencies.
Technical Analysis of the TON Token (Dailly)
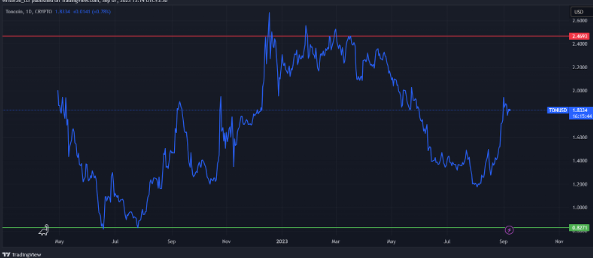
The coin is between the range of support level and the resistance level in the daily time frame.
The coin is unable to break its resistance level. Only breakout can decide whether the coin will go up or will go down.
Conclusion
Through the technical analysis, we can conclude that the coin is not performing well. In the past, it went above $2.5 and now it is around $1.82 which is not a good sign. The investors have also lost their money as it drastically felt in 2022.
Many great investors suggested not to invest in cryptocurrencies.
There were many reasons for the fall but now cryptocurrencies are slowly recovering from the downfall.
Technical Levels
- Resistance Level- $2.47
- Support Level- $0.81
Disclaimer
The analysis is done for providing information through technical analysis and no investment suggestions are given in the article to be made by investors. The coins are unpredictable so investors should have proper knowledge. Cryptocurrencies are highly volatile and risky. Investment should be made with proper technical analysis.


