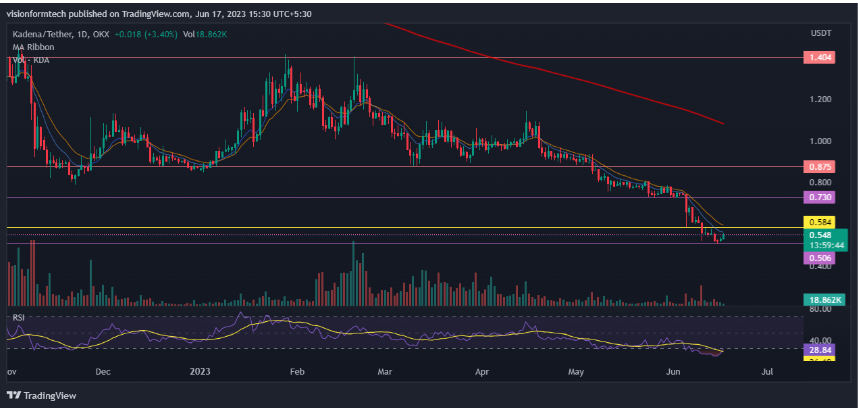
KDA, The native token of Kadena has been declining in value since its introduction on the OKX exchange. The price action is suggesting that the digital currency is only being sold and has lost 95% of its value since the initial offering.
- KDA/USDT is up 3.40% today
- KDA/USDT creates a new all-time low, again.
KDA/USDT is trading at $0.548 after bouncing 7.2% from its newly created all-time low at $0.506. This digital asset has experienced massive selling over the past year. Bulls are not showing enough interest and the trend remains bearish. The price showed some good buying in the month of February which pushed the It to its daily resistance at $1.404.
The Daily chart shows a bearish price action

According to the Daily chart, the price saw a rejection from its daily resistance and has fallen since. What added to the selling pressure was the formation of a head & shoulders pattern on the daily timeframe. The bears manage to pierce the neckline of this pattern at $0.878 in the month of May. This event resulted in a decline of almost 40%.
At present the price is 49% below its Daily 200 EMA. All the technical indicators suggest a very bearish price action as the price keeps making lower lows. This condition has created tension amongst the investors who are currently looking at losses. The market participants consist of sellers who got trapped after buying at higher prices.
The 4H chart shows less buying volume.

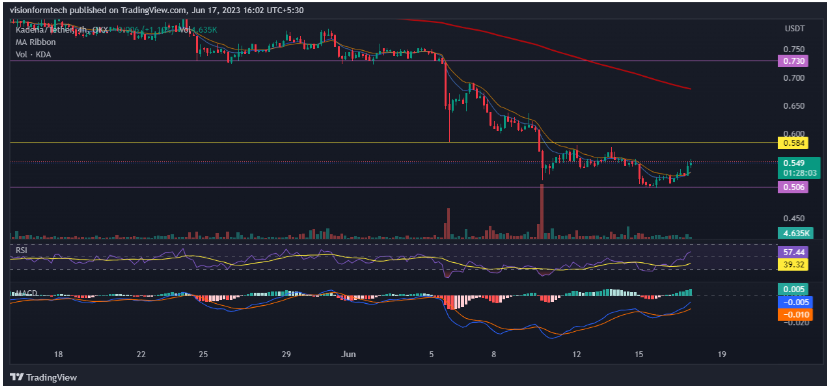
On the 4H Chart, We can analyze the volume and clearly make out the absence of high-volume buyers. This is an indication that the bulls are now afraid after taking losses and are not willing to buy even at lower levels. A small hope can be ignited if the price manages to break through the resistance level of $0.5484.
This price action will create a higher high, breaking the downtrend in the short term. This might motivate buyers as the potential upside could be at least 24% before the bulls run into the resistance level of $0.730. It is also important for the price to trade above the 200 EMA for it to turn bullish.
RSI: The RSI indicator is currently at 57.44 and the RSI has crossed the MA line towards the upside. This is a sign of bullish to sideways market condition.
MACD: The MACD indicator made a bullish crossover. The MACD is still below the 0 line indicating that the market is still bearish.
200 EMA: As observed, on the 4hr, the price is trading below the 200 EMA(exponential moving average) which acts as a significant resistance. This is a clear indication of a downtrend where the sellers are in control and for a trend reversal, the price must break and trade above the 200 EMA.
Technical levels
Support Levels: $0.506- Support 1
Current Price: $0.548
Resistance Levels: $0.584 – Resistance 1
$0.730 – Resistance 2
Conclusion
KDA is overall in a bearish trend. Investors must wait for more confirmations for a reversal. The asset is trading in uncharted territory as the price makes new lows. This creates uncertainty for the future of this digital currency. On the other side, some investors are looking at this as a good opportunity because of the potential upside. Although the current price action suggests that KDA is a very risky investment. Investors must follow proper risk management and plan accordingly.


