

ETHEREUM is in a correction phase after the price rallied to the $2000 mark. The Bulls managed to break the $1700 level and are trying to defend the same. This pullback caused ETH to lose almost 20% in value.
- ETH/USDT is down 0.51% today
- ETH/USDT has formed a descending wedge pattern during the correction phase
ETH/USDT is trading at $1729.68 after getting a bounce of 4.87%. This surge came right after the price made a short trip below the $1700 level and made a rebound from a mid-term trendline which is playing the role of an important support. This correction phase led to the formation of a descending wedge which has an upward potential.
The Daily chart shows the price is forming a descending wedge
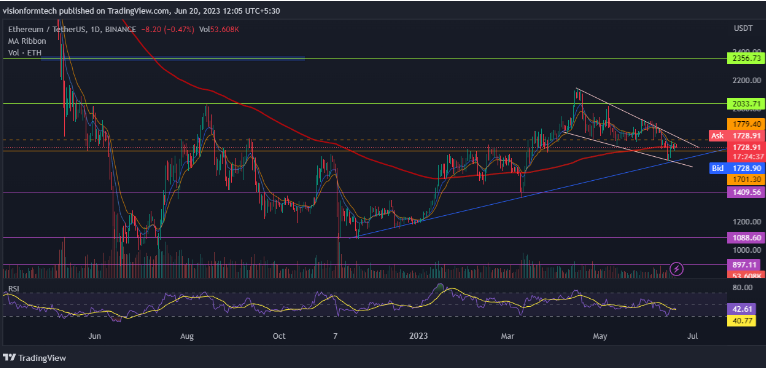
As per the analysis on the Daily chart, the price action for ETH closely followed the BTC price. This led to the formation of inverse heads & shoulders. This pattern eventually broke out when the bulls pierced through the level of $1700. This breakout contributed to the surge of almost 22% where the price took a halt after a failed attempt to sustain above the $2000 level.
This came down as a part of the correction phase and has been consolidating in the downward direction. This movement has led to the formation of a descending wedge and can be fairly interpreted as a bull flag in an uptrend. The price targets of the bull flag and the head and shoulders pattern are around the levels of $2350. At present, the price is barely above the Daily 200 EMA where the pulls are trying hard to keep the prices high.
The 4H chart shows a minor consolidation
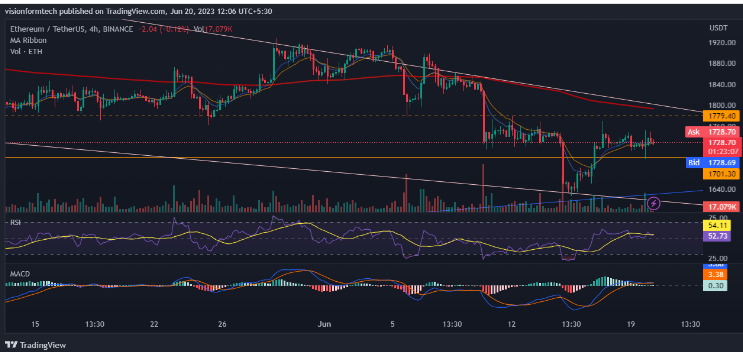
The 4H chart is conveying that the price action is in a consolidation. After getting support from the trendline, the price managed a V-shaped recovery and has been in a consolidation phase. As the price is below the 4H 200 EMA, the bears will be dominating the market.
The main duty of the bulls is to hold the trendline. A failure to adhere to this may lead to the beginning of a bear market. If a daily candle closes below the trendline, we are looking at a downhill ride of at least 30% to the $1034 level. On the upside, if the price breaks out of the descending wedge, a new journey will begin where the price will rally at least 15% before its first pit stop at $2000 and another 15% if the resistance is breached as well.
RSI
The RSI indicator is currently at 54.16 and the RSI has crossed the MA line towards the upside. This is a sign of bullish to sideways market condition.
MACD
The MACD indicator made a bullish crossover, but the MACD and the signal line are sticking to each other. This is a sign of a sideways momentum and a big move could be on the way.
200 EMA
As observed, on the 4hr, the price is trading above the 200 EMA(exponential moving average) which acts as a significant support. This is a clear indication of an uptrend where the buyers are in control and for a trend reversal, the price must break and trade below the 200 EMA.
Technical levels
Support Levels: $1630 – Support 1
$1409 – Support 2
Current Price: $1729.68
Resistance Levels: $1780 – Resistance 1
$2000 – Resistance 2
Conclusion
ETH is getting a correction from its recent rally to $2000. The price is trapped in a descending wedge pattern and the bulls are looking forward to breaking it. Meanwhile, the bears are eyeing the trendline and will try to infiltrate it. It is the prime duty of the bulls to defend the trendline. Any failure to do so would result in a bloodbath and the market will be looking at a long bear season.