

- Bitcoin Gold is at its critical support level.
- Bitcoin Gold (BTG) is currently trading at $13 with a rise of 1.31% in the 24 hours.
- The Bitcoin Gold price is observing an increase of 14.16% in the last 7 days.
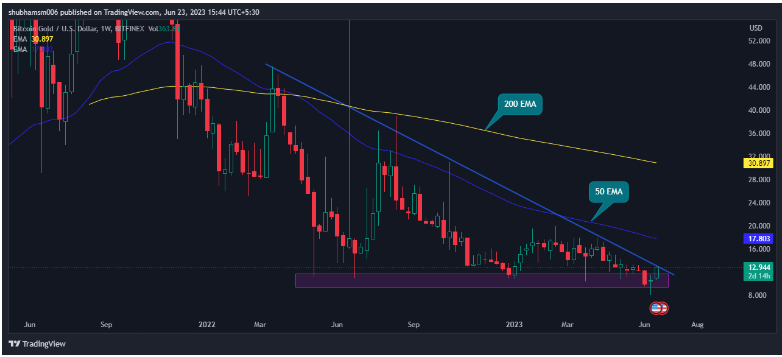
According to the weekly chart of the coin, BTG is in a do-or-die situation, either a breakout or a breakdown. Currently, the price is at a critical support level. BTG is beneath the 50-day and 200-day EMA. The price is getting rejections from Trendline and also from 50-day EMA.
Trend Evaluation
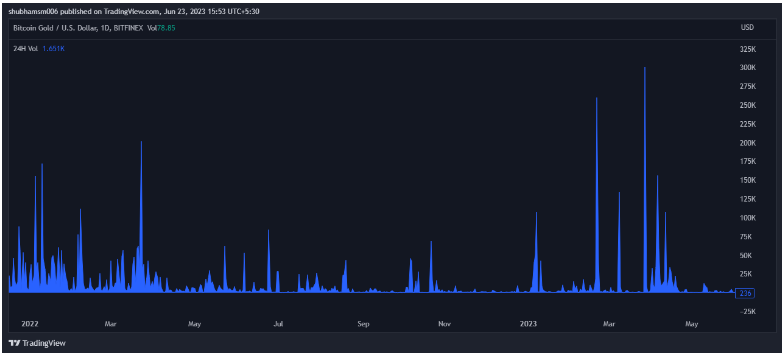
By evaluating the price data of the BTG coin, it can be said that it is in a downtrend currently. The price inclined by 14.16% in the last seven days and we can say that Bitcoin Gold performed well last week. From its peak price of $456.25, it fell -97.15% in the last 5 years. The coin demolished 97 percent of the investor’s wealth. The current market sentiments are not good about the coin. No huge volume is present in Bitcoin Gold (BTG). Buyers are not available in the present market scenario and they are also not taking any interest in buying. The market is under the control of the bears.
Bitcoin Gold (BTG) Technical Analysis
The price of Bitcoin Gold (BTG) has slipped below 50 and 200 EMA, which suggests that the price is in a bearish trend. There is a possibility that the coin’s value will fall even further in the upcoming week if the seller continues to push the price down. The price has been consolidating near 50 days EMA again which shows that bears are not in the mood to give power to bulls.
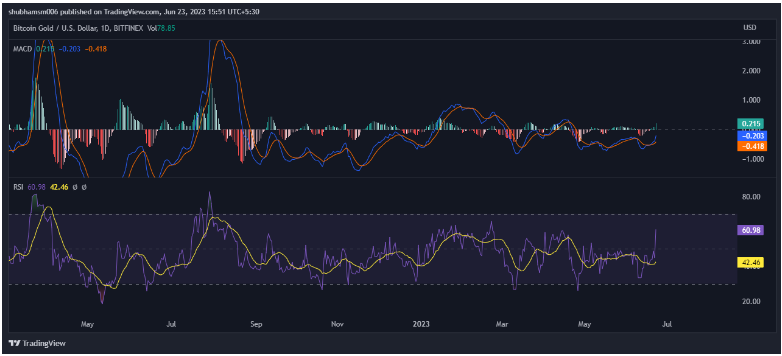
The technical indicator MACD is also in the negative zone. The MACD line at -0203 and signal line at -0.418 is below the zero line, suggesting that the MACD is in negative territory and is giving bearish signals.
The current value of RSI is 60.98 points. The 14 SMA line is currently below the median line, around 42.46 points which shows bearish sentiment in the market. The 14 Day SMA line below the median line indicates a bearish trend. The RSI is moving toward an overbought zone which is a good sign.
Volume Analysis
The Bitcoin Gold (BTG) trading volume of 24 hours is $15636700, with a 24.30% increase in volume. There is a significant boost in the volume of the coin.
Trendline Analysis
The price is respecting its significant Trendline support, and it is going toward resistance. Breaking the trendline will cause the price to go upwards, and if the price is rejected by the resistance, then it will come back down.
Technical Levels
Support – The current support level of BTG is $9.13.
Resistance –The current resistance level of BTG is $13.500.
Conclusion
BTG is in a dicey situation. The price action suggests that the price may fall more in the upcoming days if it broke its primary trendline support level. BTG prices currently show a pessimistic outlook. Major reliable indicators like EMA, RSI, and MACD give negative signals about the Bitcoin Gold (BTG) coin. The fear is growing among investors because of the inadequate performance of the coin.
Disclaimer
The analysis given in this article is for informational and educational use only. Do not take this information as financial or trading advice. Trading and investing contain financial risk. Before making any investment or trading decision, please consider your risk profile and circumstances.