- Analysts suggest that the NextNav Inc. stock price will reach the $7.83 level.
- The NN stock price recovered almost 96.25% in one year.
- NextNav Inc.’s stock price is trading above its 200-day EMA.
Analysts suggest that the NN stock price will have the potential to break its major resistance level at $7.83. At that point, the stock price will continue consolidating until any breakout.
From the $1.85 level, the price continued moving in an uptrend and recovered almost 96.25% of its value. It causes an enormous amount of pressure on the sellers but they are more likely to approach major supply zones.
The NextNav Inc. stock price is making strong impulsive bullish candles time and again. There is no surprise that the stock price is trading above the 200-day EMA.
Can the NN Stock Continue Bullish Momentum

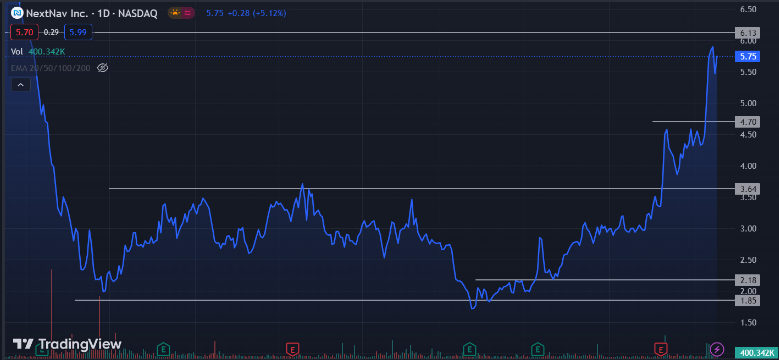
As per this area chart, we can suspect major support and resistance levels, which are basically formed during trading sessions. On 24 March 2023, the NN stock price slowly rose to major resistance at $3.64. After breaking out that price level, the stock is impulsively rallying toward 1 more major resistance.
However, at a current trading price of $5.75, the stock is more likely to retest the previous support level at $4.70. After that buyers will try to approach this stock.
From the impression of bullish impulsive candles, we can surely expect that the stock price will break the $7.83 level.
Technical Analysis the NN Price Chart

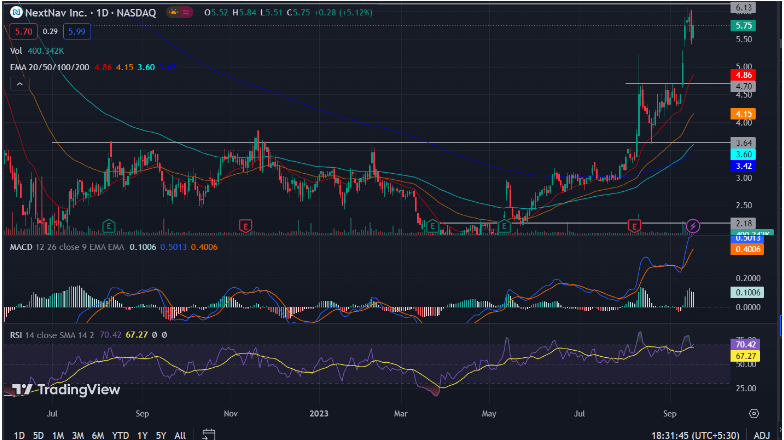
Technical analysis of indicators tells where the price is moving based on the average price level. The 20-day, 50-day, 100-day EMAs crossed the 200-day EMAs on a bullish move. It clearly indicates that the NN stock price is currently trading at the $5.75 level, above its average range. The average price range of EMAs is $4.86, $4.15, $3.60 and $3.42.
The MACD indicates the volume of bullish and bearish sessions. As per technicals, the MACD line is at 0.5013 and the signal line at 0.4006 with continuously moving on high volume levels. That means buyers are more active than sellers in this trading session.
The Relative strength index (RSI) line is averaging at 70.42 and the signal line showing strength at 67.27 (Overbought). The indicator indicates that the price is on the top of its upper band 70.00. It means that the strength and volume of buyers are too high.
Supertrends Can Be a Good Indicator
Technical Levels
- Resistance Levels: $6.13 and $7.83
- Support Levels: $4.70 and $3.64
Disclaimer
The views and opinions stated by the author, or any people named in this article is for informational purposes only. They do not establish financial, investment or any other advice. Investing in or trading in stock comes with the risk of financial loss.


