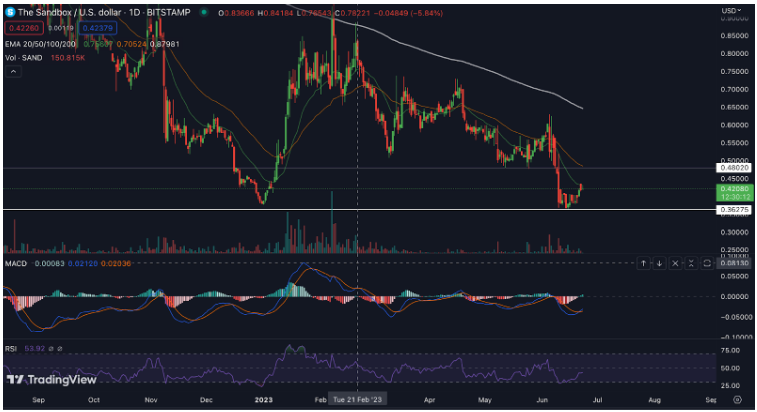
- Last week, the price of SAND cryptocurrency plunged significantly, reaching a six-month low and falling nearly 45%.
- The price of Sandbox (SAND) is trading around $0.42.
- The 24-hour volume is $8336M which decreased by 0.08% in 24 hours.
Introduction
The Sandbox (SAND) cryptocurrency is based on the Ethereum network. It intends to establish a decentralized and user-driven virtual metaverse in which players may develop, own, and monetize digital products and game experiences.
The Sandbox platform includes several tools, including VoxEdit, a voxel-based game builder that allows users to generate and animate 3D elements. These assets are then uploaded and integrated into the virtual world of the Sandbox, where players can explore and interact with them. Non-fungible tokens (NFTs) are used by the network to represent ownership of these digital assets, enabling scarcity and verified ownership.
Trend Analysis
SAND witnessed a major reversal in direction over the last week, falling about 45% before finding support under 0.3380. The breach of a key support level at 0.4820 resulted in a 52-week low, while the resistance from the 200-day EMA at 0.6050 adds another layer of complication. Now SAND price rising from the support level indicating bullishness.
SANDBOX (SAND) is Trading in Downwards Direction
Technical Analysis (1D Timeframe)

SANDBOX(SAND) Price Analysis
MA: The SANDBOX (SAND) price is currently trading above the 20-50 EMA crossover, which indicates that the price is indicating the downtrend momentum in the day time frame.
RSI: There is a high likelihood the price will dominate the level and it will go above. The RSI (Relative Strength Index) is a popular momentum indicator that reveals overbought and oversold levels. SAND’s RSI is oversold on the daily chart, potentially indicating a reversal or a period of consolidation. However, the weekly chart has not yet hit oversold territory, implying that negative pressure may continue in the longer term.
MACD: When the signal line cuts the MACD from below, the indicator is considered to be bullish. In the same way, when the signal line gets cut by the MACD line from the above region, the indicator is considered to be bearish. In this case, MACD is giving a crossover from above, it is indicating bearishness in a short time.
Trendline Analysis
As per the Trendline, the price is respecting the trendline and the price is reversing from the support level indicating further move till the above line of the channel.
So, as of now, the price of the SAND moving in the channel can go up to $0.480 in a short time to touch the trendline and if it sustains at the level breakout can be seen in upcoming trading days.
Conclusion
According to the analysis, the indicators are supporting the movement in the bearish direction side in a short time. If the price breaks the above level with good volume, we can expect it to move further up. Currently, the overall trend of the SANDBOX in a larger time frame is in a downtrend as it has touched its all-time low recently.
Technical Levels
- The Nearest Support Level is $0.3627.
- The Nearest Resistance Level is $0.48020.
Disclaimer
The views and opinions of the author, or anyone named in this article, are for informational purposes only. They do not offer financial, investment, or other advice. Investing or trading crypto assets involves the risk of financial loss.


