- Reserve Rights Price Prediction expresses strong bearish sentiments as the market digs deeper.
- RSR Coin witnessed a moderate recovery of almost 40% from its all-time low
- RSR Token delivered a loss of 65.93% in one year.
Reserve Rights Price Prediction uncovers a sight bloodbath in the market as RSR Token dives into unexplored territory. RSR Coin is trading at $0.002524. The Market is up 1.42% in the last 24H. The 24H Volume witnessed a dump of 24.11%. The overall market cap of $RSR Token is $127,200,795.
Rpay, A stablecoin wallet developed by the team of Reserved Rights managed to secure a license from the U.S. Office of Foreign Asset Control (OFAC). This will allow the wallet to continue its operations in Venezuela to help residents secure their savings amidst hyperinflation.
Reserve Rights Price Prediction: Exploring new lows

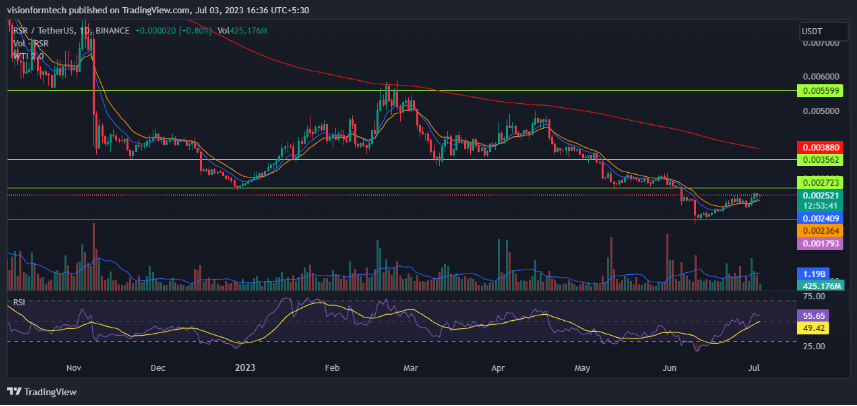
Source: RSR/USDT by TradingView: https://www.tradingview.com/x/iu7c4CXw/
Analyzing the daily chart unveils the bearish sentiments for RSR token as the prices dive to unexplored depths. From the beginning of this year, RSR Coin witnessed a massive rally of 100 % to a key resistance level of $0.005599. The prices started declining sharply and saw a fall of almost 70% since Feb.
Reserve Rights Price Prediction uncovers the disturbed psychology of investors who are under the stress of falling prices. Meanwhile, a few interested buyers helped the prices recover by almost 40% from their new all-time low of $0.001672. The path of recovery is filled with multiple hurdles starting with $0.002723 as the first resistance.
A moderate recovery from support: Technicals

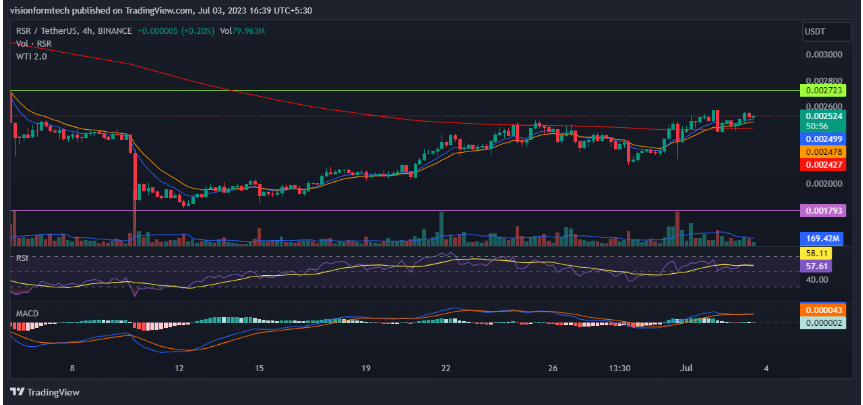
Source: RSR/USDT by TradingView: https://www.tradingview.com/x/bUpBX3ys/
Digging deeper into the 4H time frame, A small hope comes in the form of a minor uptrend. KSR Crypto gradually makes its way towards the resistance where the Bulls are hoping to break it. This will mark a new beginning where KSR Price may move 30% towards the next pit stop at $0.003562.
Currently, the market has a majority of trapped buyers and short sellers who are adding to the sell pressure. Technical Indicators represent sideways conditions. The overall performance of KSR is getting hindered as the bears won’t stop unloading their bags. A further downfall won’t be surprising in this strong downtrend.
Technical indicators:
RSI: The RSI indicator is currently at 56.36 on the 4H. It represents a lack of momentum and a sideways condition.
MACD: MACD is moving along the signal by its side and the histogram bars are small in size. The indicators are above the 0 line. It suggests that momentum is missing and the price is moving sideways
.
200 EMA: As observed, on the 4hr, the price is trading above the 200 EMA(exponential moving average) which acts as a significant support. This indicates an uptrend where the buyers are in control and for a trend reversal, the price must break and trade below the 200 EMA.
Conclusion:
Reserve Rights Rights Price Prediction uncovers a sight of a bloodbath in the market as RSR Token dives into unexplored territory. New lows weaken the hopes of investors. Meanwhile, a few buyers are looking to feed upon this fear and gamble with a calculated risk as the prices are already. RSR Coin isn’t showing any strong reversal sign and investors may wait for the breakout of the resistance.
Technical levels
Support Levels: $0.002157 – Support 1
$0.001793 – Support 2
Current Price: $0.002524
Resistance Levels: $0.002723- Resistance 1
$0.003562 – Resistance 2
Disclaimer:
The views and opinions stated by the author, or any people named in this article, are for informational purposes only and do not establish financial, investment, or other advice. Investing in or trading crypto assets comes with a risk of financial loss.
Keyword: Reserve Rights Price Prediction, RSR Token
Meta description: Reserve Rights Rights Price Prediction uncovers a sight bloodbath in the market as RSR Token dives into unexplored territory.
Meta Tags: Reserve Rights Network PRICE, RSR PRICE, RSR Crypto, RSR Token, RSR Coin


