Axie Infinity Analysis: Will AXS Breach Critical Support Soon?
- AXS/USDT has broken from the support of a descending triangle which acted as a daily support
- AXS/USDT is down 20% from breaking its previous support
AXS price is trading at $4.94 after breaking down from a major Support level of $ 6.00. It formed a descending triangle, which is a trend continuation pattern with a bearish bias. This Breakdown suggested intensive selling pressure and has led to the downfall with a probability of further downside towards the primary support at $3.35
The daily chart shows Bear Dominance
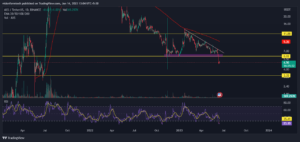
Source: AXS/USDT Binance price chart TradingView
On the Daily Time frame, the price created a high at $13.71. Still, it was unable to sustain the resistance level of $11.81 and saw a rejection after which the price saw a declining and formed a descending triangle which eventually broke support on the 10th June and was followed by some aggressive selling.
This indicates that the bears are controlling the market and further downfall is expected towards its next support zone. Also, the price is trading below 200 EMA which clearly shows a downtrend.
Short Term Charts show a minor consolidation
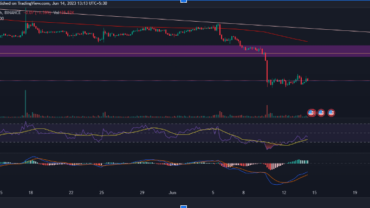
Source: AXS/USDT Binance price chart TradingView
On the Shorter Time frame, the 4H chart price action is suggesting a minor consolidation and there isn’t much buying at this level. This is a sign of weakness and the price could potentially see lower levels in the near future.
If the Price Starts moving towards downside , its first level of support will be at $3.35 which is still a solid 31% downside from where the bulls might see a potential buying opportunity.
RSI: The RSI indicator is currently at 41.95 which indicates that the strength is low in the market and the bears are in control.
MACD: The MACD indicator has made a Crossover but the price didn’t show a significant rise which indicates that the sellers might be booking profits but aggressive buying is missing.
200 EMA: As it is observed, on the 4hr, the price is trading below the 200 EMA(exponential moving average) which acts as a significant resistance. This is a clear indication of a downtrend where the sellers are in control and in order for a trend reversal, the price must break and trade above the 200 EMA.
Technical levels
Support Levels:$3.35 – Support 1
$2.25 – Support 2
Current Price: $4.94
Resistance Levels: $6.02 – Resistance 1
$11.81 – Resistance 2
Conclusion
The Price prediction for AXS suggests a bear trend and a probability of further downfall as the nearest primary support zone is still 31% down, The Price has broken major daily support and the overall trend is bearish. The next primary support is at $3.35 which is closely being watched by the potential buyers.