
- SDRY stock price is falling hard after a gap-down opening.
- The 50 EMA gave a hard rejection to the stock. What is next?
Just five years ago, Superdry investors were witnessing remarkable growth in the company’s share price, reaching impressive heights. However, with the advent of the COVID-19 pandemic, Superdry faced significant challenges due to its business being in the fashion sector rather than a necessity-based segment. This resulted in a substantial decline of more than 41% in sales.
The impact of these factors was clearly reflected in the company’s annual reports, leading to a sharp crash in the Superdry stock price. Despite a partial recovery observed in 2021, the stock remained far from its pre-pandemic high levels.
Compounding the difficulties, Superdry cited the ongoing cost of living crisis as a contributing factor to its woes. The company’s most recent half-yearly report revealed a staggering negative sales growth rate of over 200%. This tumultuous financial performance is clearly influencing the trajectory of the Superdry stock price, with investors showing consistent signs of selling amid these challenges.
Technical Analysis of Superdry Stock Price.
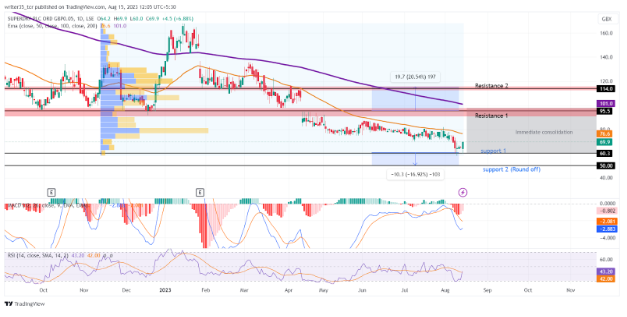
Starting from January with a gap-down opening, Superdry’s stock experienced an unbroken streak of negative trend, forming a consistent downtrend. At the moment of writing, the Superdry stock price has tested its immediate support and appears to be showing potential signs of rebound.
After breaking through major support levels, the stock is now situated within a range defined by various resistances and rounded-off support levels. Meanwhile, the technical indicators are also providing insights into the potential direction in the near future.
Support: The initial and immediate support, which also coincides with the last notable volume support, is established at GBX 60.3. This level’s testing occurred in the year 2020. Additionally, a psychological support level can be observed at GBX 50.
Resistance: The first resistance is noted at GBX 95.5, a level that experienced a breakdown due to bearish pressure in April 2023. The second resistance exists at GBX 114.0, which also represents a previously breached support level.
MACD: Since March 2023, the MACD graph has remained consistently within negative territory. At the present moment, the MACD line has crossed over the signal line, suggesting a potential bearish momentum on the horizon. The specific levels for MACD and the signal line are -2.883 and -2.081, respectively.
RSI: Following a touch of the oversold level at 30, the RSI line has shown a minor increase and currently appears to be poised for a crossover with its Simple Moving Average (SMA) at the level of 43.20.
EMAs: Since March 2023, the 50 EMA has consistently remained positioned above the stock price. Presently, it is situated at GBX 76.6, maintaining a significant gap from the 200 EMA at GBX 101.1. This suggests that both EMA lines are indicating a lack of immediate reversal signals.
Conclusion
The price prediction for Superdry stock is bearish as the company is showing no signs of financial improvement and the price has just taken a rejection from the 50 EMA. The Superdry stock price is hovering over the last support, which shows that the bearish sentiments are high and so are the risks.
Technical levels
Support: GBX 60.3, GBX 50.0
Resistance: GBX 95.5, GBX 114..0
RSI: 43
50 EMA: GBX 76.6
200 EMA: GBX 101.0
Disclaimer
The views and opinions stated by the author, or any people named in this article, are for informational purposes only. They do not establish financial, investment, or other advice. Investing in or trading crypto assets comes with a risk of financial loss.