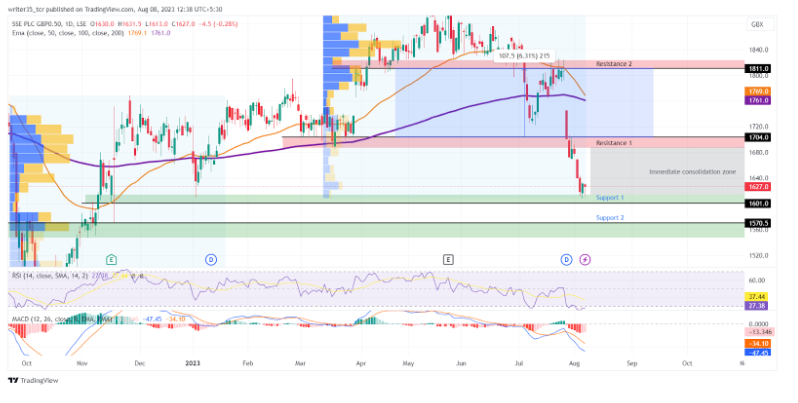
- The SSE stock prediction: SSE reported a gross loss, see how the market has reacted and what’s next.
- The stock has broken its major support level. What are the next supports?
- The EMAs are looking to cross. What would be the result of this cross-over in the near future?
About SSE Plc
SSE PLC founded in 1998, is a multinational company engaged in the business of generation of renewable energy. The company is listed on the London stock exchange and is based in Perth, Scotland. SSE is led by the CEO, Alistair Phillips-Davies, with an employee size of more than 11K people.
Brief Financial Highlights for the Year Ended in March 2023
The annual revenue reported by SSE in March 2023 was $15.5 Billion.
The firm has reported losses in the gross section as $-192 Million, which could be the reason the prices are dropping.
The net profit reported for the year-end came up to $-148 Million.
The return on equity is negative as per the net profit and comes up to -86%.
The company, SSE has less debt as compared to the last year as the debt to equity ratio is 0.81.
The company is selling its inventory in just 11 days, as per the inventory turnover ratio of 32.03.
The Metrics have been calculated by financial statements, provided by macrotrends.net
SSE Stock Previous Price Action and Forecasting
SSE’s Previous Price Action
The SSE stock started rising after a fall in October 2022. It went up from $1,613 to a level of $1,768 in less than a month, giving investors more than 25% during the time. Fast forward to May 2023, when the SSE stock made its recent high of $1,919.

SSE‘s Current Price Action
Currently, the stock has broken some supports and is down over 16%, as of May 2023.
Support: Currently, the stock has confirmed support of $1,1601 made in January 2023, although we have drawn the support on the last end of the range for margin of safety. Support two is seen at the level of $1,570.
Resistance: The first and immediate price resistance is being made at the level of $1,704 which is the broken support. The second resistance is at the level of $1,811. Both the pivots are supported by volumes.
Indicators
MACD: The MACD line is well below the signal line, indicating a bearish trend in the future. Both the lines came down from the point of 0 back in June 2023.
RSI: The RSI of SSE stock is seen in a very weak range of 27 which is followed by a downtrend from May 2023 where the levels touched over 68.7. If the situation comes under control, then some spikes can be seen from this level.
EMAs: The EMAs are looking forward to doing a cross which will result in bearish sentiments. The 50 EMA is looking to come down and cross the 200 EMA. The levels are very close as the 50 EMA is at the level of $1,769 and the 200 EMA is at $1,1761.
Conclusion
SSE was founded in 1998 and is currently listed on the London stock exchange. The firm is engaged in the renewable energy business. Currently, the stock is in a down trend because of the losses it posted in the annual report, with MACD, RSI, and EMAs giving bearish signals.
Technicals:
Support: $1,601, $1,570
Resistance: $1,704, $1,811
RSI: 27
50 EMA: $1,769
100 EMA: $1,761
Disclaimer
The views and opinions stated by the author, or any people named in this article, are for informational purposes only. They do not establish financial, investment, or other advice. Investing in or trading crypto assets comes with a risk of financial loss.


