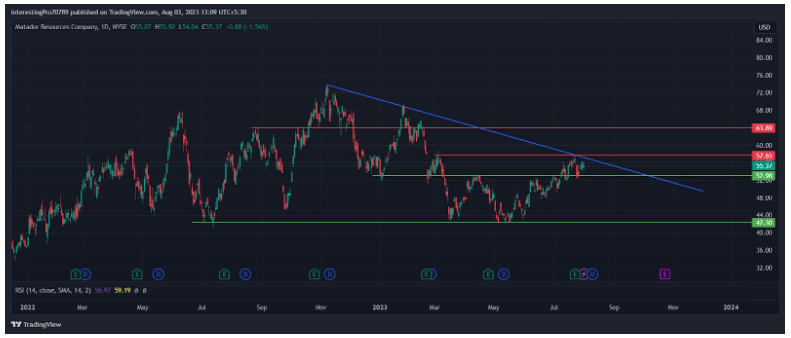
- Currently, MTDR stock price is trading at $55.37.
- The MTDR stock price has recently experienced a bullish breakout of the double bottom pattern, firmly holding above the significant double bottom neckline level at $52.98.
- MTDR stock price is also facing rejection from the trendline coming from above.

After reaching an all-time high of $73.85 in November 2022, the MTDR stock price suffered a significant decline, forming lower lows until March 2023, ultimately finding support at $42.30, a level where it had previously found support. The strong buying activity at the $42.30 support led to a price rebound from that level. Over the past five months (March to July), the stock price tested the $42.30 support level twice and experienced rejections, forming a double bottom pattern. In July 2023, there was a breakout of the double bottom neckline and resistance level at $52.98.
Presently, the MTDR stock price is holding above the $52.98 level, which now acts as a support level. However, it is facing resistance from a trendline coming from above. If the price closes below $52.98 on the daily timeframe, there is a possibility of the price revisiting the $42.30 support level. On the other hand, if the price manages to stay above $52.98 and breaks out above the trendline, it could reach levels of $57.65 and $63.89, which would be the next resistance levels.

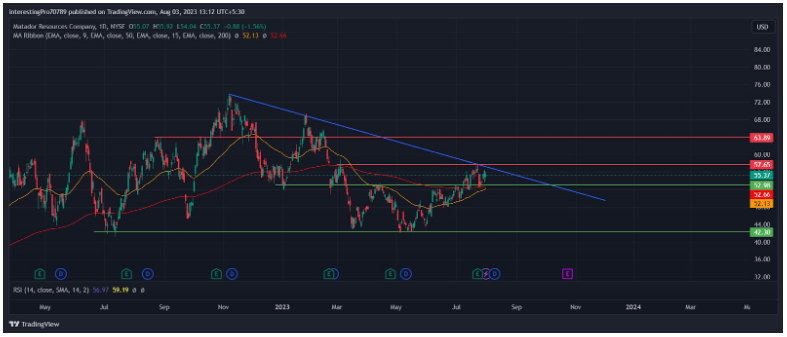
The Exponential Moving Averages (EMAs) of 50 (yellow line) and 200 (red line) for MTDR stock are currently situated close to each other, with the 50 EMA showing a slight upward trend and the 200 EMA moving sideways. If there is a crossover between these two EMAs, it could indicate a potential upward movement in the stock price towards its next resistance levels of $52.65 and $63.89.
However, if the stock price fails to maintain its position above these EMAs and closes below them, there is a possibility of the price declining towards its support level of $42.30.

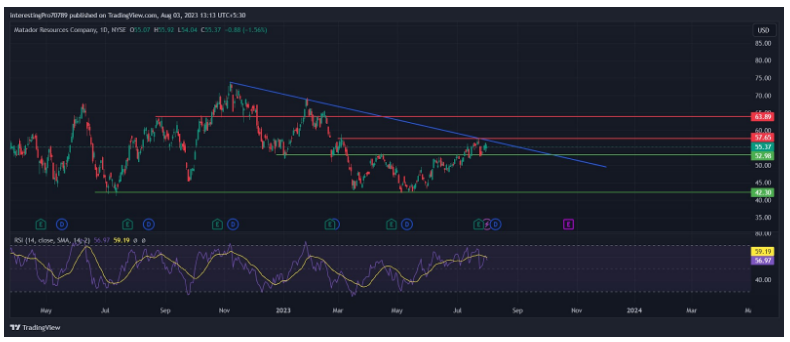
The Relative Strength Index (RSI) is currently at 56.97, indicating a moderately bullish sentiment in the MTDR stock. The RSI has found support around the 50 level, which is often considered a critical threshold. This support suggests that the buying pressure is robust and has helped the RSI to remain in the positive territory.

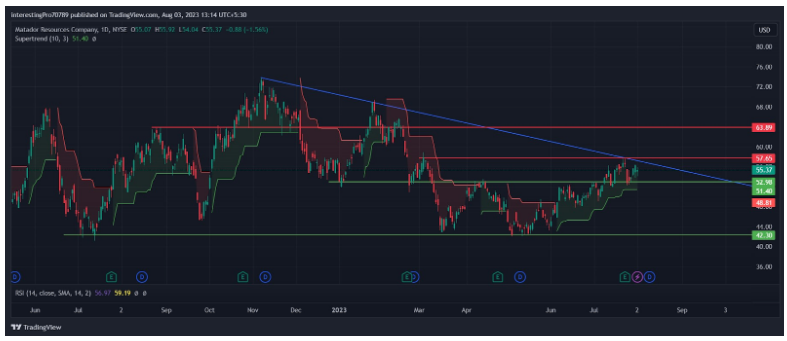
The SuperTrend indicator is currently showing a positive outlook for MTDR stock, as the price is trading above the green SuperTrend line. This suggests a strong bullish sentiment in the market, with buyers in control and the stock maintaining its uptrend.
Conclusion
As of now, the MTDR stock price is holding above the key support level of $52.98, which is a positive sign following the breakout of the double-bottom pattern. To continue its upward momentum, the price needs to maintain its position above $52.98 and ideally break above the trendline that is coming from above.
If the price manages to sustain above the $52.98 level and breaks out above the trendline, it could signal further bullish momentum, potentially driving the stock price towards the next resistance levels of $57.65 and $63.89.
However, if the price fails to hold above the $52.98 level, it may be considered a pattern breakout failure, and the stock price could potentially retest the support level at $42.30.
Technical levels
Resistance levels:$57.65 and $63.89
Support levels: $52.98 and $42.30
Disclaimer
The views and opinions stated by the author, or any people named in this article, are for informational purposes only. They do not establish financial, investment, or other advice. Investing in or trading crypto assets comes with a risk of financial loss.


